


Altered brain network community structure in body dysmorphic disorder and anorexia nervosa
Connectomic properties of Brodmann area 47 are correlated with cognitive measures in euthymic bipolar disorders
Using our novel method for modularity, Path Length Associated Community Estimation (PLACE), depressed subjects demonstrated altered community affiliation of the posterior default mode network (precuneus)..
Dynamic connectomes are generated from EEG data using a sliding window approach. Each connectome (from all subjects and all time points), mathematically defined as a 34 by 34 matrix, is mapped onto a point on a manifold that is embedded in a high dimensional space (here the manifold is depicted as a Swiss roll, a 2-dimensional structure that is rolled up and embedded in 3D). +-Thus, the distance in the high dimensional space (straight arrow) is not the manifold geodesic distance (curved arrow), which encodes the intrinsic geometric features of the manifold. This distance is used to create the neighborhood graph visualized as minimum spanning tree (MST).
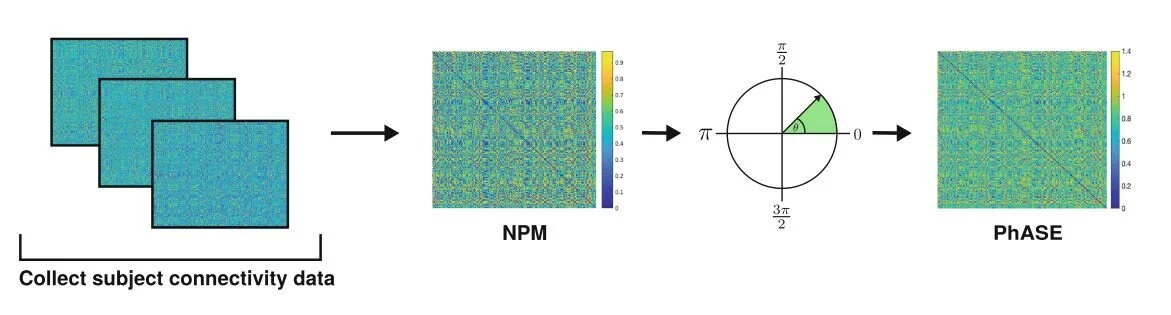
Computing PhASE from rs-fMRI data. Connectivity data is acquired from multiple subjects, and the frequency of edge negativity is computed for each ROI to form a negative probability matrix (NPM). Then, the phase angle ( θ ) is computed for each ROI, which encodes each ROI’s “phase” with every other ROI in the network.